Posts with tag 'Vital Signs 2022'
Subscribe and receive email notifications of new blog posts.
 RSS Feed
- 2026 | 27 Posts
- 2025 | 49 Posts
- 2024 | 50 Posts
- 2023 | 36 Posts
- 2022 | 53 Posts
- 2021 | 63 Posts
- 2020 | 77 Posts
- 2019 | 1 Posts
- 2018 | 2 Posts
- 2016 | 3 Posts
- 2015 | 8 Posts
- 2014 | 1 Posts
- 2012 | 1 Posts
- 2011 | 2 Posts
18
June 2022 Alabama Gulf Coast real estate stats
Alabama's Gulf Coast contains several real estate markets depending on location and price point – just to name a few factors. The graphic below shows real estate statistics for June 2022, the latest month available.
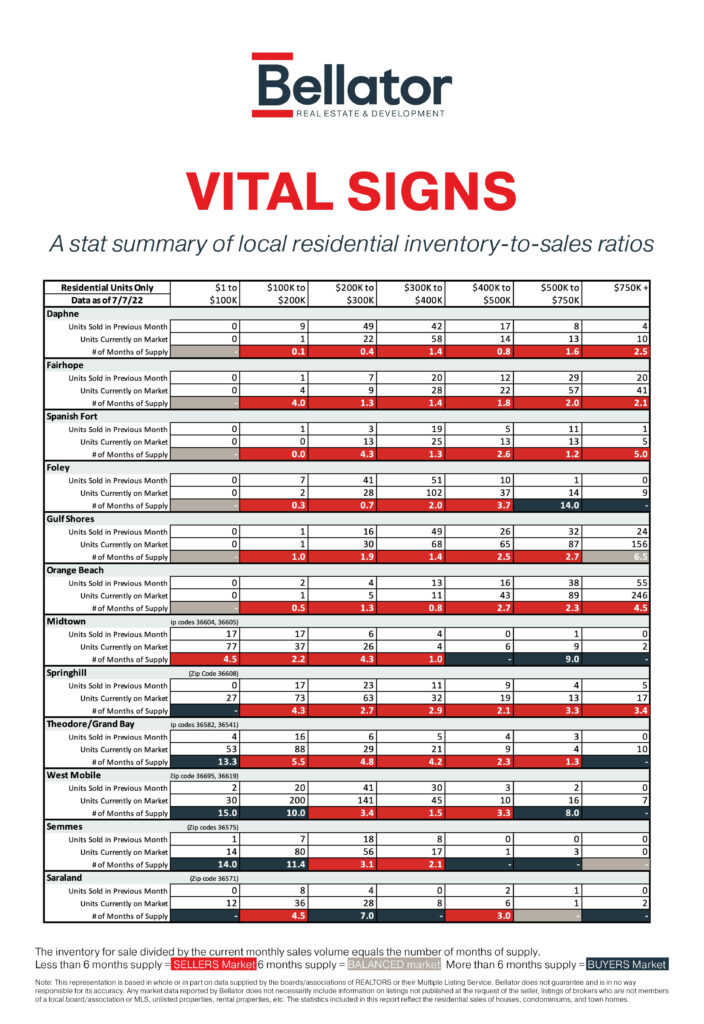
Vital Signs provides a visual representation of what's happening in several local markets by showing you supply. The colored-coded numbers represent the absorption rate, the number of months it would take to sell every home on the market in a particular price range if no others were added. If the market is moving quickly, the absorption rate will fall below six months of supply, and if it's more of a buyer's ma...
20
May 2022 Alabama Gulf Coast real estate stats
Alabama's Gulf Coast contains several real estate markets depending on location and price point – just to name a few factors. The graphic below shows real estate statistics for May 2022, the latest month available.
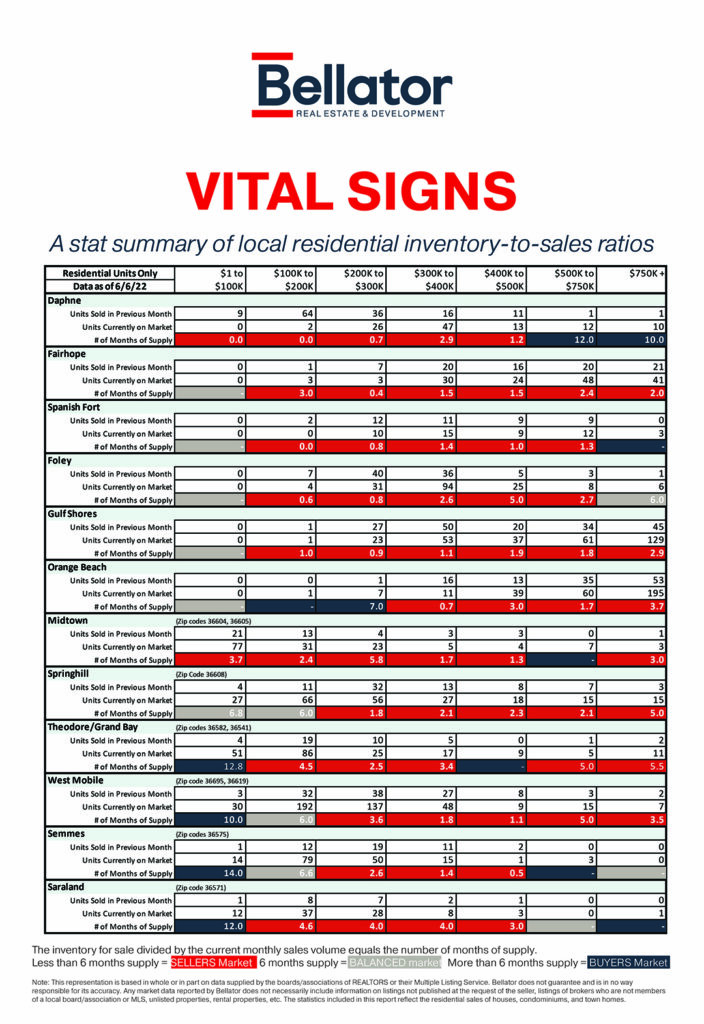
Vital Signs provides a visual representation of what's happening in several local markets by showing you supply. The colored-coded numbers represent the absorption rate, the number of months it would take to sell every home on the market in a particular price range if no others were added. If the market is moving quickly, the absorption rate will fall below six months of supply, and if it's more of a buyer's market, it will jump above six months of supply.
16
April 2022 Alabama Gulf Coast real estate stats
Alabama's Gulf Coast contains several real estate markets depending on location and price point – just to name a few factors. The graphic below shows real estate statistics for April 2022, the latest month available.
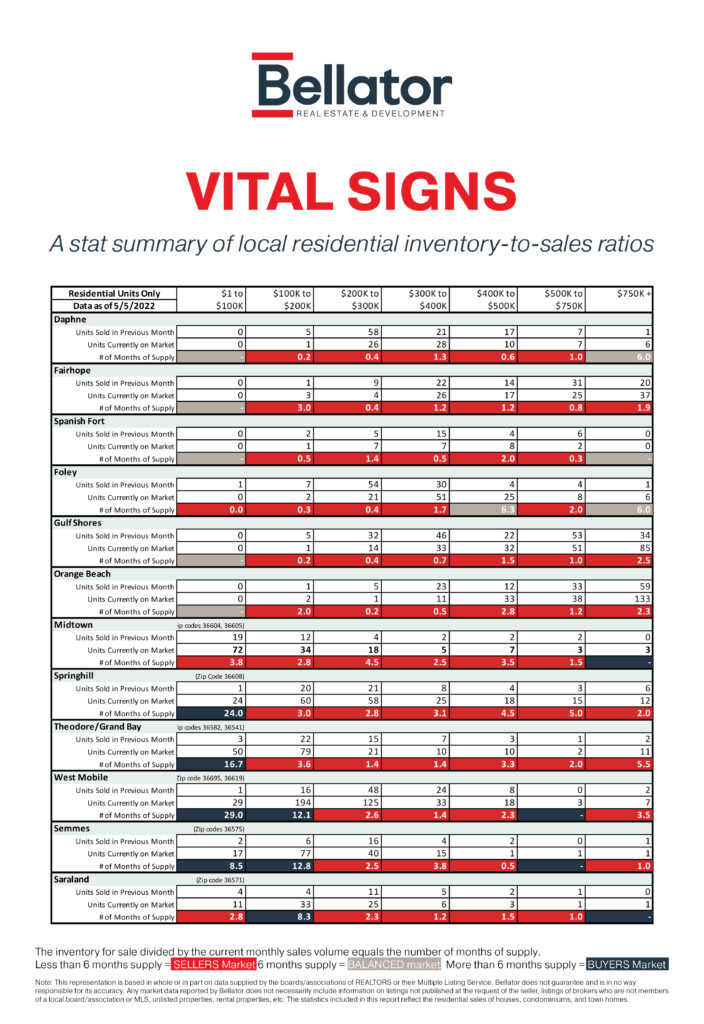
Vital Signs provides a visual representation of what's happening in several local markets by showing you supply. The colored-coded numbers represent the absorption rate, the number of months it would take to sell every home on the market in a particular price range if no others were added. If the market is moving quickly, the absorption rate will fall below six months of supply, and if it's more of a buyer's market, it will jump above six months of supply....
18
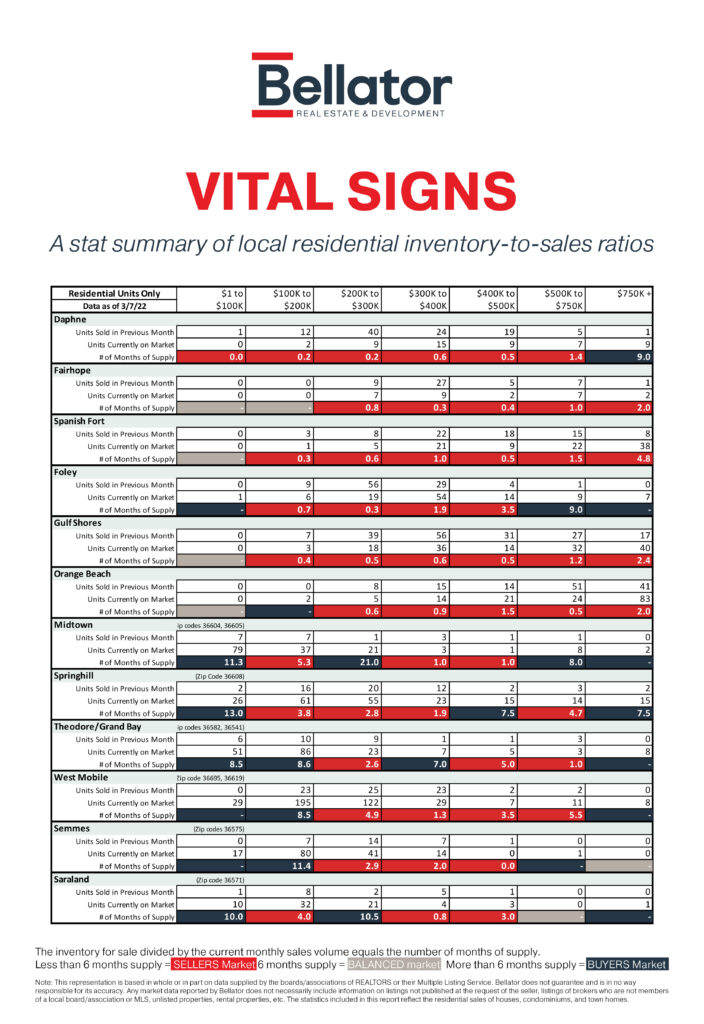
March 2022 Alabama Gulf Coast real estate stats
Alabama's Gulf Coast contains several real estate markets depending on location and price point – just to name a few factors. The graphic below shows real estate statistics for March 2022, the latest month available.
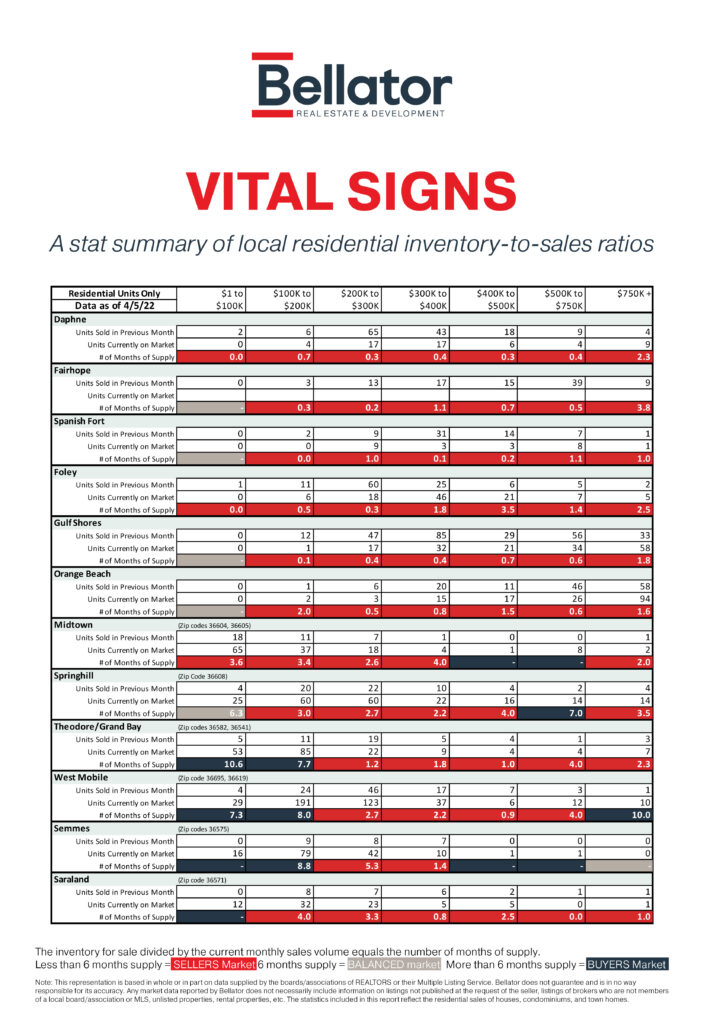
Vital Signs provides a visual representation of what's happening in several local markets by showing you supply. The colored-coded numbers represent the absorption rate, the number of months it would take to sell every home on the market in a particular price range if no others were added. If the market is moving quickly, the absorption rate will fall below six months of supply, and if it's more of a buyer's market, it will jump above six months of suppl...
14
February 2022 Alabama Gulf Coast real estate stats
Alabama's Gulf Coast contains several real estate markets depending on location and price point – just to name a few factors. The graphic below shows real estate statistics for February 2022, the latest month available.
Vital Signs provides a visual representation of what's happening in several local markets by showing you supply. The colored-coded numbers represent the absorption rate, the number of months it would take to sell every home on the market in a particular price range if no others were added. If the market is moving quickly, the absorption rate will fall below six months of supply, and if it's more of a buyer's market, it will jump above six months of supply...